Due to current events it was hard to concentrate on work lately. So I decided to learn something new but still work related.
In OpenStack Kolla project we provide images with Collectd, Grafana, Influxdb, Prometheus, Telegraf to give people options for monitoring their deployments. I never used any of them. Until now.
Local setup
At home I have some devices I could monitor for random data:
- TrueNAS based NAS
- OpenWRT based router
- OpenWRT based access point
- HoneyComb arm devbox
- other Linux based computers
- Home Assistant
All machines can ping each other so sending data is not a problem.
Software
For software stack I decided to go for PIG — Prometheus, Influxdb, Grafana.
I used instruction from blog posts written by Chris Smart:
- Setting up a monitoring host with Prometheus, InfluxDB and Grafana
- Monitoring OpenWRT with collectd, Influxdb and Grafana
Read both — they have more details than I used to mention. Also more graphics.
OpenWRT
Turned out that OpenWRT devices can either use “collectd” or Prometheus node exporter to gather metrics. I had first one installed already (to have some graphs in webUI). If you do not then all you need is this set of commands:
opkg update
opkg install luci-app-statistics collectd collectd-mod-cpu \
             collectd-mod-interface collectd-mod-iwinfo \
             collectd-mod-load collectd-mod-memory \
             collectd-mod-network collectd-mod-uptime

/etc/init.d/luci_statistics enable
/etc/init.d/collectd enable
TrueNAS
TrueNAS already has reporting in webUI. Can also send data to remote Graphite server. So again I had everything in place for gathering metrics.
Next step was sorting out data collector and visualisation. There is community provided “Grafana & Influxdb” plugin. Installed it, gave jail a name, set to request own IP and got “grafana.lan” running in a minute.
Configuration
At this moment everything is installed for both gathering and visualisation of data. Time for some configuration.
Logged into jail (“sudo iocage console grafana”) and fun started.
Influxdb
First Influxdb needed to be configured to accept both “collectd” data from OpenWRT nodes and “graphite” data from TrueNAS. Simple edit of “/usr/local/etc/influxd.conf” file to have this:
[[collectd]]
  enabled = true
  bind-address = ":25826"
  database = "collectd"
  # retention-policy = ""
  #
  # The collectd service supports either scanning a directory for multiple types
  # db files, or specifying a single db file.
  typesdb = "/usr/local/share/collectd"
  #
  security-level = "none"
  # auth-file = "/etc/collectd/auth_file"
and that:
[[graphite]]
  # Determines whether the graphite endpoint is enabled.
  enabled = true
  database = "graphite"
  # retention-policy = ""
  bind-address = ":2003"
  protocol = "tcp"
  consistency-level = "one"
Save, restart Influxdb (by “service influxd restart”). Next step was creation of databases (add username and password if needed):
# influx
> create database collectd
> create database graphite
> exit
And data should be gathered from both OpenWRT (collectd) and TrueNAS (graphite) nodes.
OpenWRT
Here are two ways to do configure OpenWRT based system:
First one is visiting webUI -> Statistics -> Setup -> Output plugins, then enabling “network” plugin and giving IP of InfluxDB server.
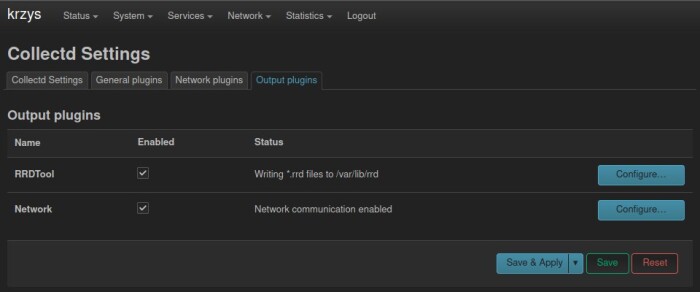
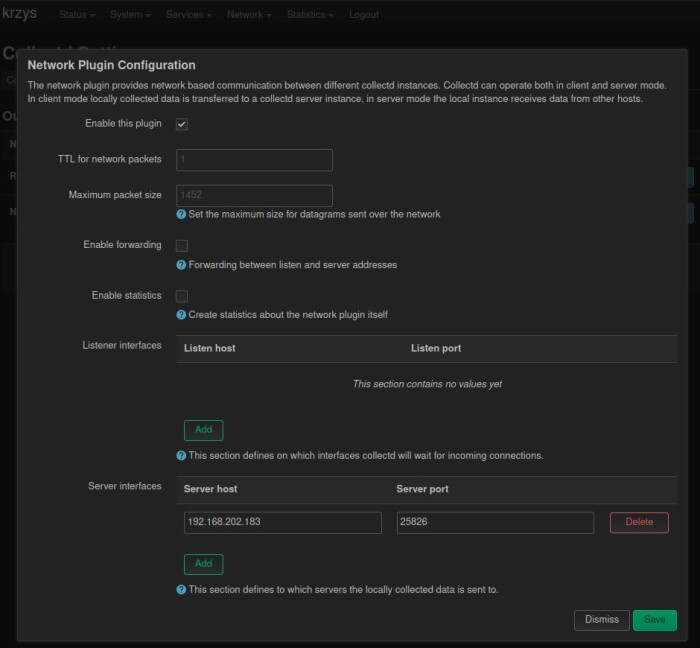
Second one is simple edit of “/etc/collectd.conf” file:
LoadPlugin network
<Plugin network>
        Server "192.168.202.183" "25826"
</Plugin>
No idea why it wants IP address instead of FQDN.
TrueNAS
TrueNAS is simple — visit webUI -> System -> Reporting and give address (IP or FQDN) of remote graphite server.
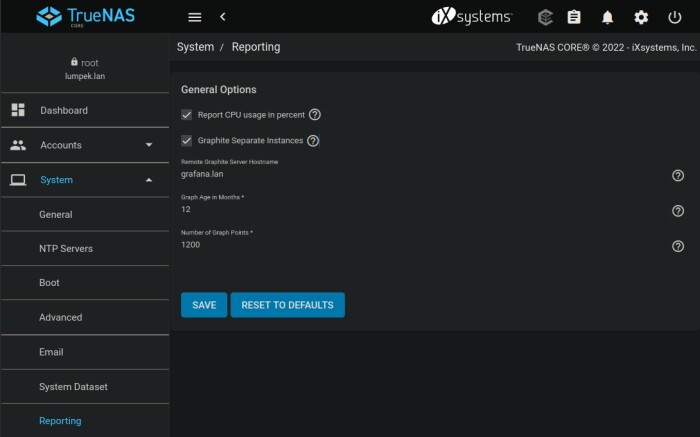
I enabled both “Report CPU usage in percent” and “Graphite separate instances” checkboxes because of Grafana dashboard I use.
Grafana
Logged into http://grafana.lan:3000, setup admin account and then setup data sources. Both will be “InfluxDB” type — one for ‘collectd’ database keeping metrics from OpenWRT nodes, second for ‘graphite’ one with data from TrueNAS.
Use “http://localhost:8086” as URL, provide database names and name each data source in a way telling you which one is which.
Visualisation
Ok, software installed on all nodes, configuration files edited. Metrics flow to InfluxDB (you can check them using “show series” in Influx shell tool). Time to setup some dashboards in Grafana.
This is moment where I went for ready ones:
OpenWRT dashboard
Hard to tell will I keep it as it provides lot of data on same graphs:
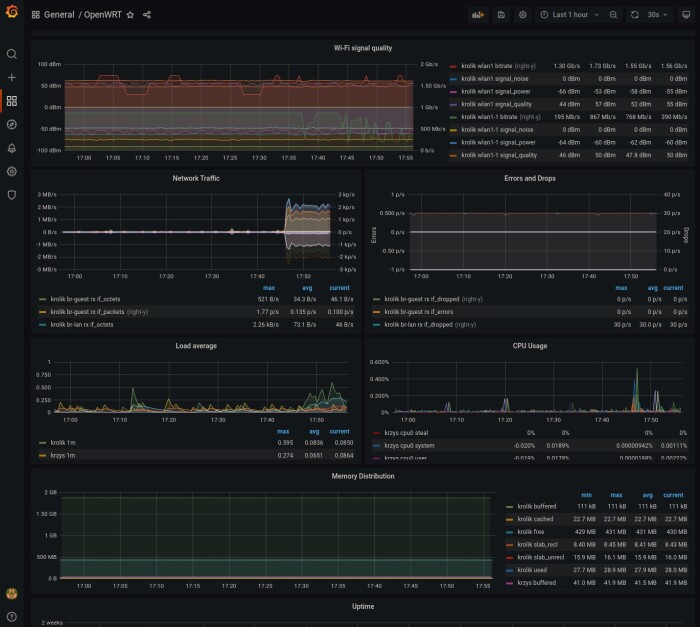
I plan to take a look at it and keep what I really need, use some aliases to see WiFi network names instead of interface names, etc.
TrueNAS dashboard
Here some editing was needed. Dashboard itself needed timezone change, 24 hours clock, adding ‘da0’ hard disk to graphs and setting ZFS pool names.
The other edit was in InfluxDB configuration (in “graphite” section) to get some metrics renamed:
  templates = [
    "*.app env.service.resource.measurement",
     "servers.* .host.resource.measurement.field*",
  ]
Effect was nice:
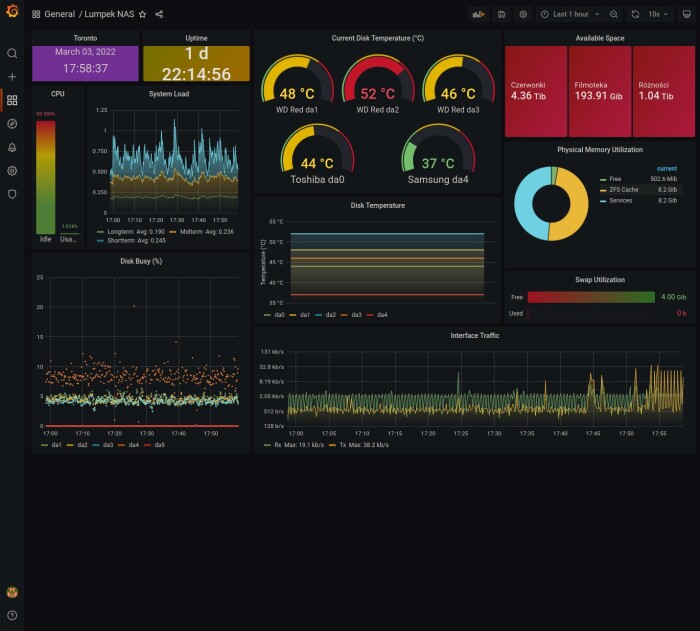
This one looks like good base. Also suggests me to visit my server wardrobe and check fans in NAS box.
Future
I need to alter both dashboards to make them show some really usable data. Then add some alerts. And more nodes — there is still no Prometheus in use here gathering metrics from my generic Linux machines. Nor my server.